
Why native English speakers don't top IELTS
In August 2026, #TidyTuesday published three years of IELTS test statistics: mean scores in Listening, Reading, Writing and Speaking, broken down by first language and by nationality. The first thing I looked for was the obvious one. Surely the people whose first language is English score highest on an English test?
They don’t. In 2024-25, German speakers led the Academic test with a mean band of 7.6. Native English speakers came third, and fifth in General Training. In three years of data, English has never ranked first.
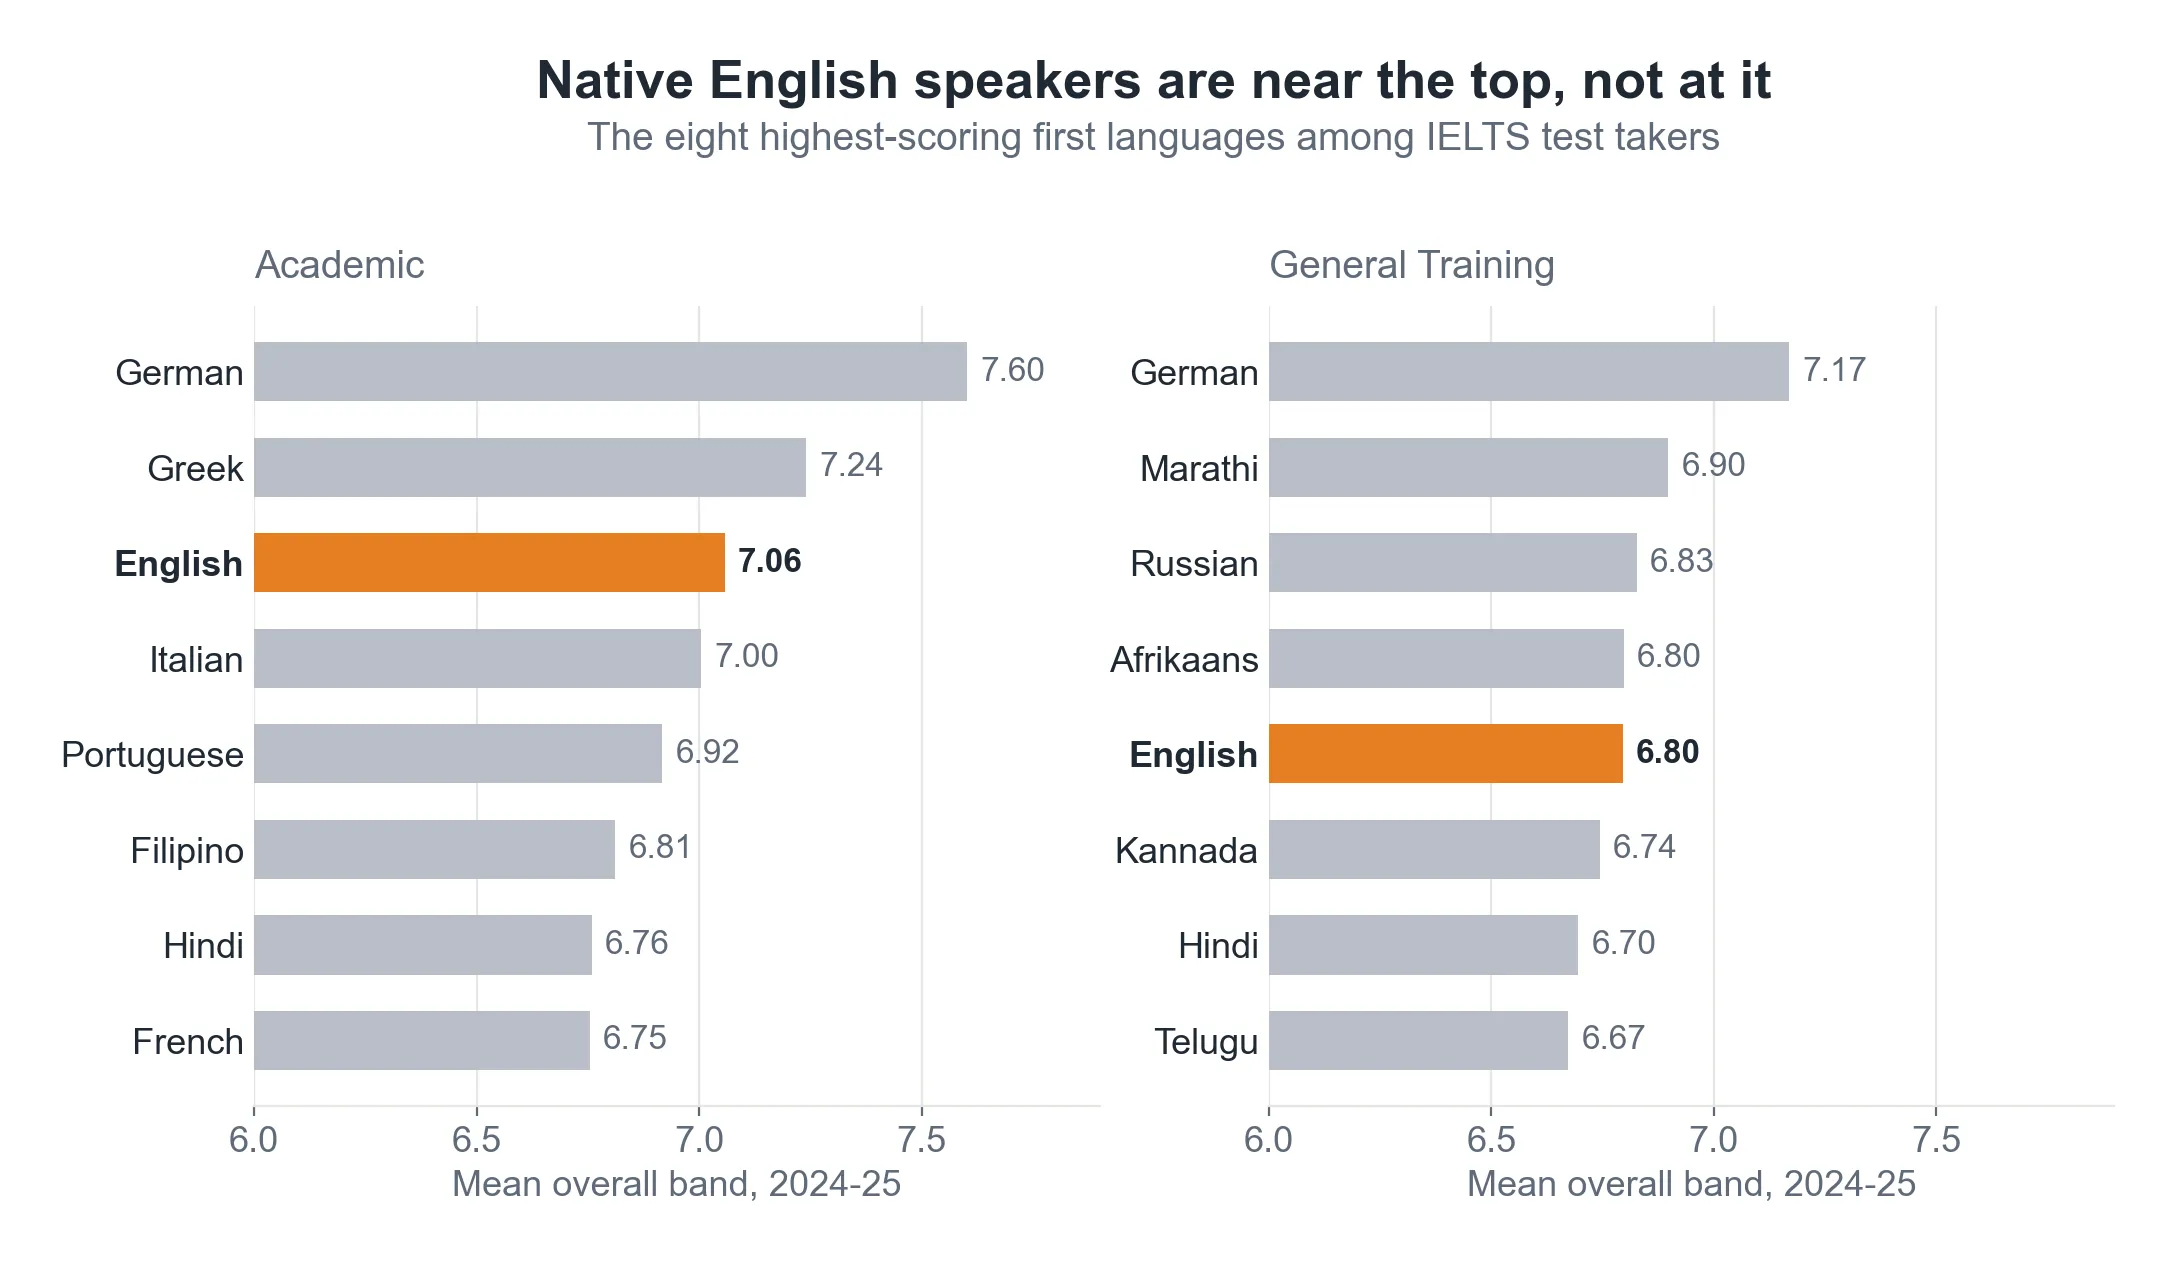
It’s a good headline. It’s also not a finding about English speakers.
The table measures who sits the test
The data only contains people who chose to sit IELTS. A German speaker usually takes it because they have decided to study abroad in English: a highly educated, self-selected group. A native English speaker usually takes it only because a visa or a registration body requires it, often in a country such as Nigeria, India or the Philippines, where English is one of several everyday languages.
A causal graph shows the problem:
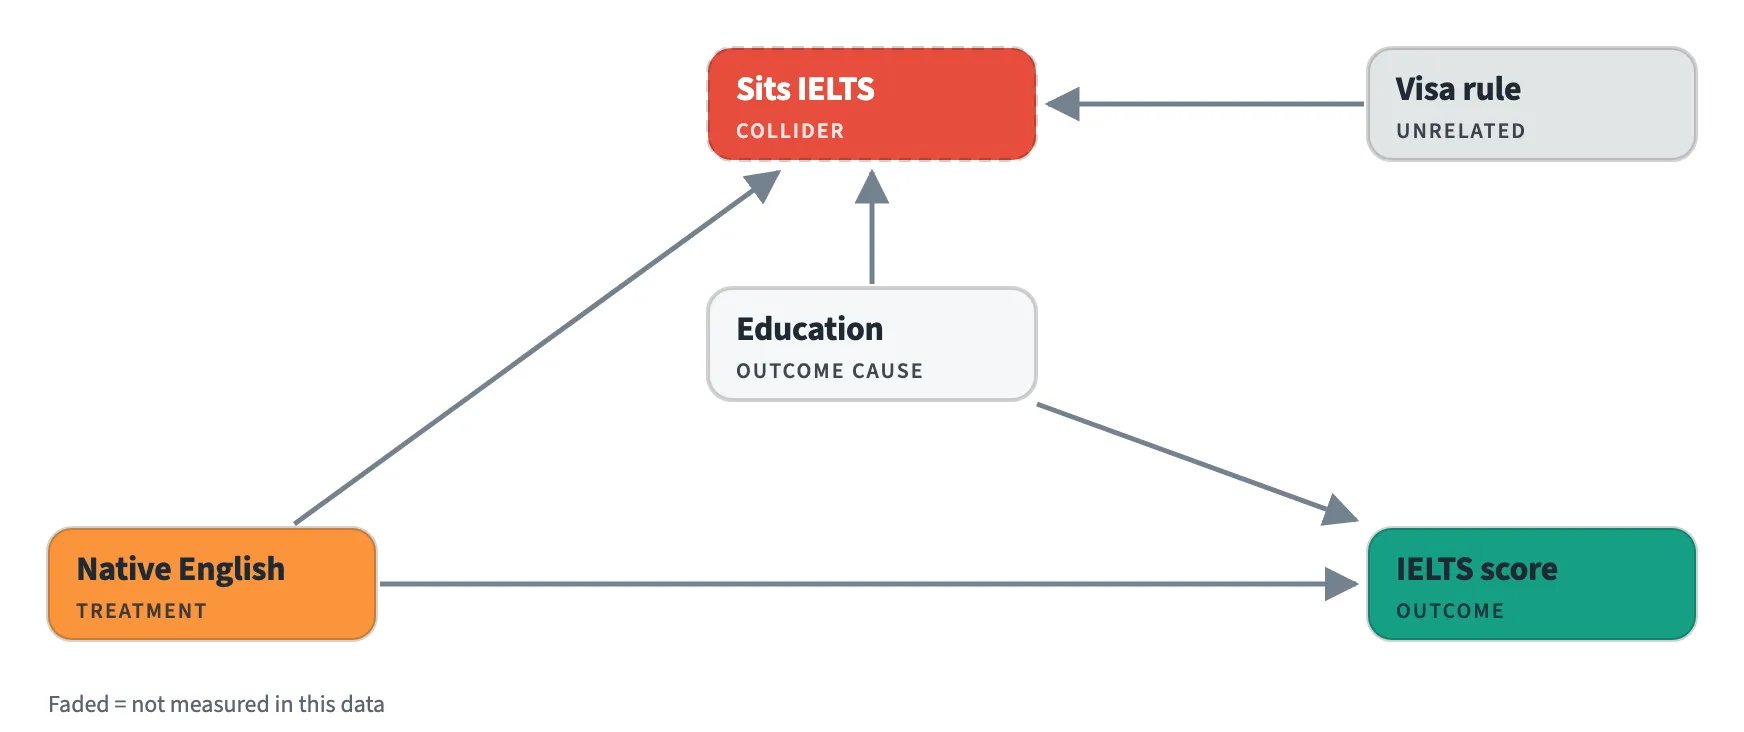
“Sits IELTS” is a collider: both being a native speaker and being highly educated lead people to the test. Looking only at people who sat it creates a link that doesn’t exist in the wider population. Among test takers, non-native speakers are disproportionately the ambitious and well-educated, while native speakers are often there because they were made to be.
So the league table can’t tell us who speaks the best English. The people who never sat the test aren’t in the data, and no amount of statistics can bring them back.
The question I tried next
I didn’t stop there straight away. One pattern looked more promising: groups from countries where English is official, such as Nigeria, India and the Philippines, tend to score further ahead in Speaking than in Writing. Comparing two skills within the same group cancels most of the selection problem, because whatever brought people to the test lifts both skills together.
But the answer depended on what I compared. Comparing countries only with their regional neighbours, official English came with speaking about a fifth of a band further ahead of writing. Comparing former British colonies with each other, the effect disappeared, because the non-official former colonies are mostly Arabic-speaking, and Arabic speakers have large speaking-over-writing gaps of their own. Comparing like with like on both counts left too few countries to say anything.
When a result flips depending on which reasonable comparison you choose, the data isn’t answering the question. So I stopped.
Why the graph came first
The league table was the easy analysis, and it was the wrong one. The numbers weren’t wrong; the question just couldn’t be answered with this data. Drawing the graph showed that before any model was fitted.
That’s the case for drawing causal graphs first. They don’t always give you an answer. Sometimes their most useful job is telling you that your data can’t, before you publish one.
Thanks to Georgios Karamanis, whose TidyTuesday chart, “Germany speaks the best test English”, set me looking at this question. His title is exactly right: the data can only describe the people who sat the test. The data is IELTS’s published test statistics for 2022-23 to 2024-25, via #TidyTuesday. The causal graph is drawn in the style of Causal Blocks.